Fu Sha, Zou Ji, Liu Linwei
China National Center for Climate Change Strategy and International Cooperation (NCSC)
Translated by China Carbon Forum
On 30 June 2015, the Chinese government submitted its Intended Nationally Determined Contribution (INDC), detailing its commitment to climate change mitigation and adaptation for the post-2020 period. Highlights of the INDC include specific goals such as:
?? To achieve peak carbon dioxide emissions by approximately 2030, or sooner as best efforts allow;
?? To lower carbon dioxide emissions per unit of GDP by 60% to 65% from 2005 levels;
?? To increase the share of non-fossil fuels in the primary energy mix to approximately 20%; and
?? To increase the volume of forest stock by approximately 4.5 billion cubic meters over 2005 levels, and; Continue to proactively adapt to climate change through: enhanced mechanism- and capacity-building; the effective management of climate change risks in sectors such as agriculture, forestry, and water resources and in regions including urban, coastal, and ecologically vulnerable areas; improved early warning and emergency response systems and disaster prevention and mitigation mechanisms.
This article offers an analysis of China’s INDC in terms of its basic assumptions and considerations, the ambition and fairness of the intended contributions, and the obstacles and challenges facing China in achieving these goals.
1.Basic Assumptions and Considerations
The recent IPCC Fifth Assessment Report further confirmed the imminence of climate change based on science and observed facts. The international community is faced with a serious challenge in addressing climate change and achieving its target of capping the increase in the average global temperature at 2°C. Low-carbon development has emerged as a mainstream trend of development worldwide, and is indeed a necessary condition to achieving sustainable development. In this context, the INDCs proposed by each country should be motivated by an interest in containing the risks of climate change and actualizing equitable opportunities to achieve sustainable, low-carbon development.
Even though China has become the largest carbon emitter and the second-largest economy in the world, its main development indicators and the ongoing bifurcation of rural and urban economic structures demonstrate the fact that China is still a developing country. This implies significant differences between China and developed countries in terms of their respective stages of development, development needs, historical responsibilities, and over capacity. China’s foremost strategic priorities continues to focus on poverty alleviation, increasing incomes, bolstering social security, expanding coverage of public services (including infrastructure), and generally raising the standard of living. Meanwhile, China's traditional input-heavy growth model is no longer sustainable. Constrained by limited resources and environmental pressures, China risks falling into the “middle-income trap.” China must therefore seek an innovative new path of development and upgrade its growth model to a “new normal”: shifting the drivers of growth from the quantity of input to the efficiency of input; reducing dependence on energy, resources, and environmental inputs; cultivating new growth points and competitive advantages; and adopting a low-carbon, efficiency-focused path of development.
The system of indicators underlying China’s INDCs reflects the need for transformation and innovation in China's model of development; these indicators include an intended time target for peak emissions and quantitative indicators designed to evaluate carbon efficiency (including targets for carbon intensity, share of non-fossil fuels, and carbon sinks). China is committed to changing its path of development; exploring innovative, sustainable and low-carbon models that differ from the traditional development pathways of both the US and the EU; and creating the technological, financial, and other conditions necessary to achieve this transformation.
China’s INDC also contains a range of implementation measures and policies designed to mitigate existing climate change risk and fulfill the INDC's mandate across mitigation, adaptation, financing, technology development and transfer, capacity building, and transparency. China's INDC also calls for broadening and deepening south-south cooperation on climate change, including the establishment of a fund for south-south climate cooperation
2.Ambition and Fairness of Contributions
On the whole, the INDC demonstrates China’s overall determination to take serious action on climate change, control greenhouse gas emissions, strengthen adaptation capacity, and actively engage in global governance, including the acceptance of reasonable international commitments.
A.The implementation of China's INDC will promote economic decoupling from carbon emissions.
As can be seen from Table 1 and Figure 1, economic growth is the major contributor to the increase in China’s carbon dioxide emissions. Relative to 2005, China’s GDP per capita will grow 3.2x, 5.2x and 11x by 2020, 2030, and 2050, respectively. Implementation of the INDC can contain the increase of China’s energy-related CO2 emissions over the same time period to 1.8x, 2x and 0.84x, respectively. This indicates a decoupling between China’s economic growth and carbon emissions; that is, the economy’s dependence on carbon will be reduced, creating more favorable conditions for the transition toward a low-carbon path of development.
The major reason for the decoupling will be the decrease in energy intensity per unit of GDP (which in turn will benefit from industrial restructuring and improved energy efficiency) and the decarbonization of China’s energy mix. By 2030 and 2050, China’s energy intensity per unit of GDP will drop roughly 57% and 82%, respectively, relative to 2005 levels, while its carbon intensity per unit of energy will drop by 20% and 61%, respectively.
In particular, during the period of 2005 to 2020 and the period of 2020 to 2030, the contribution from decreasing energy intensity will be more significant than the decarbonization of the energy mix. From 2030 onward, the contribution from the decarbonization of energy will become more pronounced.
Table 1 Major factors in implementation of China’s INDC (2005=100)

Sources: Data of 2005 and 2010 are from China Statistical Yearbook, China Energy Statistical Yearbook and China’s official review of target completion. Data after 2015 is developed based on INDC scenario study results calculated by the PECE model of NCSC and Renmin University of China.
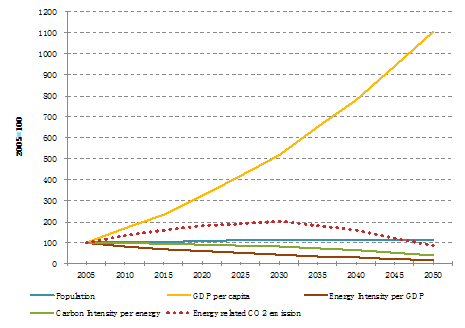
Figure 1-1 Change of major driving factors after the implementation of INDC in China (2005 = 100)

Figure 1-2 Decomposition of the change in China’s energy–related CO2 emissions
Sources: Data of 2005 and 2010 are from China Statistical Yearbook, China Energy Statistical Yearbook and the China’s official review of target completion. Data after 2015 is developed based on INDC scenario study results calculated by the PECE model of NCSC and Renmin University of China.
B.China’s post-2020 emission reduction efforts will be stepped up considerably beyond its current 2020 commitments.
Table 2 demonstrates that the annual rate of decline of China’s CO2 emissions intensity will accelerate from 3.9% in the 2005-2020 period to 4.4% in the 2020-2030 period, with the potential to reach 6.3% in the 2030-2040 period and 9.2% in the 2040-2050 period. Meanwhile, China will speed up the building and deployment of non-fossil energy projects to secure growth in non-fossil energy sources. By 2030, China’s installed capacity of non-fossil power is expected to increase by approximately 900 gigawatts from 2014 levels, an increase roughly equivalent to the country’s total installed thermal power capacity in 2014, and much higher than expected U.S. and European increases over the same period (see Figure 2). Average annual installation of non-fossil capacity will increase from 41.5 gigawatts per year in the period from 2005-2020 to 62.8 gigawatts during 2020-2030, and to 90 gigawatts in the 2040-2050 period.
Table 2 China’s Efforts to Reduce Carbon Intensity and Develop Non-fossil Sources of Energy
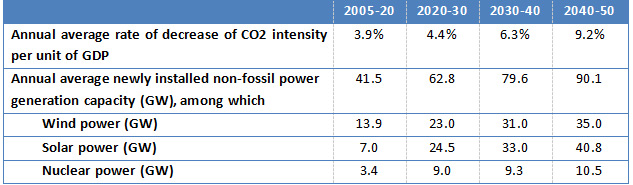
Sources: Developed based on INDC scenario study results calculated by the PECE model of NCSC and Renmin University of China. The carbon intensity and non-fossil target in 2020 are calculated as 45% and 15%, and in 2030 as 65% and 20%, respectively.
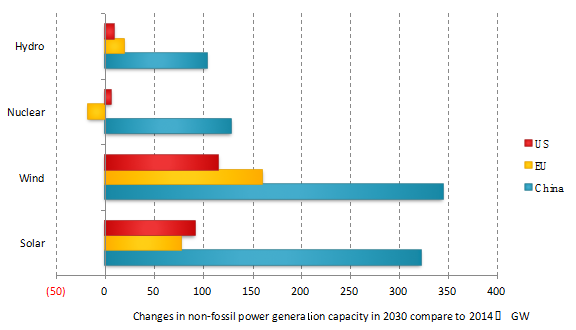
Figure 2 US, EU, and China changes in non-fossil generation capacity (2014 vs. 2030)
Source: Developed based on INDC scenario study results calculated by the PECE model of NCSC and Renmin University of China. U.S. and EU data are from World Energy Outlook 2015 Special Report by IEA, covering the change by 2030 over 2013.
C.As a second-mover developing economy, China has – through the implementation of its INDC targets – the potential to transition to a less carbon-intensive mode of development, causing emissions to peak lower and earlier than more developed countries.
Historical CO2 emissions trajectories of major economies form a Kuznets curve (an inverted ‘U’ curve) relative to economic development, i.e., as GDP per capita increases, CO2 emissions per capita rise to a peak point and then drop. Although the height of that peak varies from country to country, all economies appear to conform to this trend of an emissions “rise before a fall.”
Most major developed countries' per capita CO2 emissions peaked at 10-22 tons when per capita GDP reached 20,000-25,000 USD (in 2010 price levels). Yet according to China’s INDC targets, per capita CO2 emissions could peak at approximately 8 tons at a time when China's per capita GDP will likely be only 14,000 USD. This could be a major highlight of China’s status as a second-mover developing economy. Considering China’s position as the “world’s factory” and its abundance of coal resources, it is likely that the peak values of consumption-based emissions and energy use will be lower than those of developed countries.
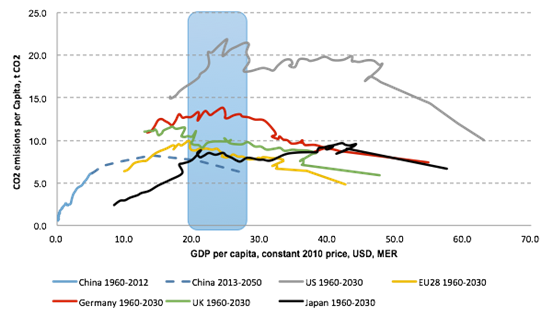
Figure 3 Trajectory of GDP and CO2 emissions per capita of major economies
Data sources: only contains energy-related CO2 emissions. Data of historical CO2 emissions from 1960 to 2012 is quoted from CDIAC. Population and GDP information are cited from the World Bank. Data after 2012 is calculated based on INDC targets of each economy.
D.If China can realize the 2030 targets proposed in the INDC, it will lay a solid foundation for the achievement of the global goal of limiting temperature increases to within 2°C.
The recent IPCC Fifth Assessment Report includes a series of forecast scenarios which are consistent with China’s actual situation and which have a likelihood (of at least 50%) of limiting global temperature increases to within 2°C. The emission reduction requirements for China in these scenarios are largely consistent with the targets set by China's INDC. A key determinant will be whether China can accelerate the pace of decarbonization after passing peak carbon in 2030; if so, it is possible that China’s long-term development can be aligned with the international goal of limiting the increase in average global temperature to below 2°C. In Figure 4, the dotted lines—which simulate emission footprints under the INDC scenario (before and after energy data readjustment)—fall right into the range (in purple shade) of multiple IPCC AR5 scenarios which are both consistent with the 2°C temperature goal and are realistic given China’s current situation. Since China’s INDC contains detailed arrangements for technology, financing, policy mechanisms and capacity building, and is designed to avoid the lock-in effect of urbanization, infrastructure construction and high-carbon industry through improved urban spatial planning and administrative limits on energy-intensive industries, it is fair to conclude that the successful implementation of the INDCs would enable China to make significant progress in improving its development approach, consolidating public support, refining policy and institutions, building a reserve of technical and innovative reserves, capital stocks and flows, and comprehensive and specialized capabilities. This progress would lay a solid foundation for accelerated transition in the post-2030 period.
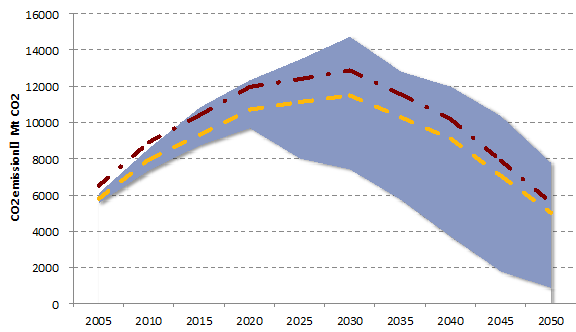
Figure 4 Relation between China’s INDC scenario and IPCC 2°C Scenario
Note and sources: the purple shade stands for a range of multiple possible scenarios from the IPCC AR5 scenario database (more than 50% probability of achieving 2°C goal) that are feasible given China's current situation, including scenarios developed by global models like GCAM, IMAGE, MERGE, MESSAGE, POLES, REMIND, TIAM-ECN, WITCH, etc. Scenarios with 2010 and 2015 emission levels which differed significantly from China's actual emissions levels were removed. The yellow dotted line stands for China's emissions trends when implementing INDC targets (without consideration of Chinese energy data adjustment in 2014), calculated with the PECE model developed by NCSC and Renmin University of China. The red line describes a rough trend taking into consideration the Chinese energy data adjustment in 2014. To make the data comparable with global data, the CO2 emissions include energy-related CO2 emissions plus CO2 emissions from cement production.
E.Implementation of the INDC can keep China’s cumulative emission levels (through 2030) at a lower level than both the US and EU
The IPCC Fifth Assessment Report confirmed the approximate linear relationship between global warming and cumulative emissions. As demonstrated in Figure 5, various developed countries reached their peak periods of GHG emissions between 1850 through 1990. During that period, the process of industrialization itself was marked by high levels of GHG emission. In China, CO2 emissions grew sharply since the mid-20th century, in particular from the rapid industrialization during the period of ‘reform and opening’, which begin around 1980. Under the INDC targets, China's cumulative energy-related CO2 emissions (through 2030) will remain lower than those of the US and the EU (at that time, the ratio of cumulative energy-related CO2 emissions among US, EU and China will be 1.4:1.2:1.0). China's 2030 cumulative may even be lower than the US and EU's current (1751-2012) cumulative emission levels. China’s cumulative emissions per capita from 1751 to 2030 are also projected to be much lower than the US and EU (by 18% and 30% respectively).
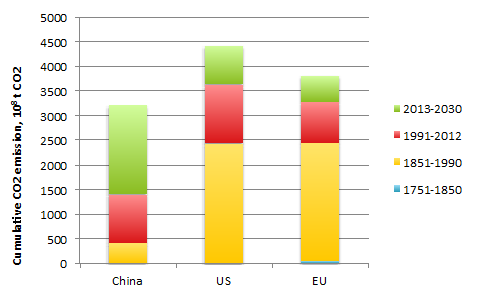
Figure 5-1 Cumulative CO2 emissions comparing China, US, and EU
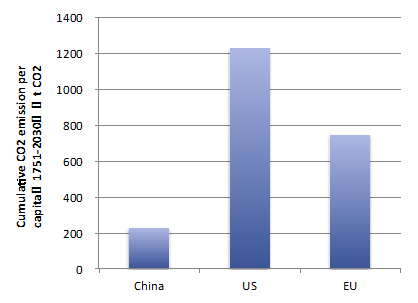
Figure 5-2 Cumulative CO2 emissions per capita comparing China, US, and EU
Sources: only contains energy-related CO2 emissions. Data of historical CO2 emissions from 1960 to 2012 are dran from CDIAC. Population and GDP information are cited from the World Bank. Data after 2012 is calculated based on INDC targets of each country.
F.China's experience will serve as a demonstration and reference for other developing countries, while offering additional support for developing countries through south-south cooperation initiatives.
As the world's largest developing country, China's growth serves as a model for many other developing countries. China's transition to an innovative path of development likewise offers a model that other developing countries can follow in pursuing sustainable development. Learning from China’s experience, other developing countries can avoid reliance on traditional, high-carbon modes of development and associated lock-in effects, enabling them to embark on new development paths that are more efficient, innovative, and result in less pollution and lower emissions. China's own transition will in turn promote global transition, thereby contributing to the improvement of development modes worldwide.
3.Difficulties and challenges facing China in achieving INDC targets
While China’s future development is clearly trending toward low-carbon growth, China will face a number of challenges in achieving its INDC targets, including constraints resulting from China's current stage of economic and social development, its underlying economic structure, and limited natural reserves, energy resources, energy efficiency, technological capacity, institutions and policy, as well as complexities in the international political and economic landscape at large.
1.Access to natural resources is a key risk factor in the achievement of China's INDC. Abundant sources of natural gas and other clean energies, for example, will be necessary to replace coal consumption. Securing access to a sufficient and reliable supply of resources and ensuring national energy security while controlling costs will be a major challenge as China seeks to achieve its INDC targets.
2.As China is still in the process of industrialization and urbanization, heavy industry sectors such as steel, petrochemicals, construction materials, and equipment manufacturing continue to represent a large portion of the economy. This economic makeup, combined with the scaling up of infrastructure development that comes alongside rapid urbanization, is likely to result in increased energy consumption and carbon emissions. While the Chinese government has committed to rebalancing the economy, the fact remains that industrial restructuring cannot be accomplished overnight, and downward pressure on the economy presents serious challenges to transition.
3.As a rising proportion of the Chinese population enters the middle class, increasing emissions from transportation and building are likely to surpass emissions from manufacturing over the medium- to long-term. In order to achieve the targets set out in the INDC, the younger generation must be educated to adopt low-carbon lifestyles and consumption habits.
4.The relative reliability and uncertainty of technology is another major challenge China faces in achieving its INDC objectives. For example, China needs to address issues surrounding renewable energy generation and the reliability of power grids, environmental impacts from hydropower, the safety of nuclear power, and the uncertainty of carbon capture and storage (CCS) technology.
5.As a developing economy, China lags in terms of overall technological sophistication, with limited R&D capacity in certain key technologies, especially in low-carbon and adaptation technology. Effective international cooperation to secure access to technology will be an important factor in the successful implementation of the INDC targets.
6.Achieving the mitigation and adaptation targets will require enormous investment and construction costs. While some of these are incremental investments that will generate economic returns, a greater majority of these—such as the application of CCS technology—will engender economic costs. In addition to these economic costs, China may face social costs in the process of transitioning, such as structural unemployment caused by the closure of outdated production facilities. Additional measures will be necessary to mitigate these social impacts.
7.Capacity among key stakeholders remains limited, and there is an urgent need to raise social awareness and improving institutional and social mechanisms dealing with climate change. China lacks the macro-management capabilities to address climate change and its legislative and policy systems remain underdeveloped. China still lacks a sound statistical and accounting system for GHG emissions and is comparatively weak in the monitoring and calculation of GHG emissions, as well as in regulation and enforcement. All of these shortcomings represent challenges for China as it seeks to realize its INDC targets.